|
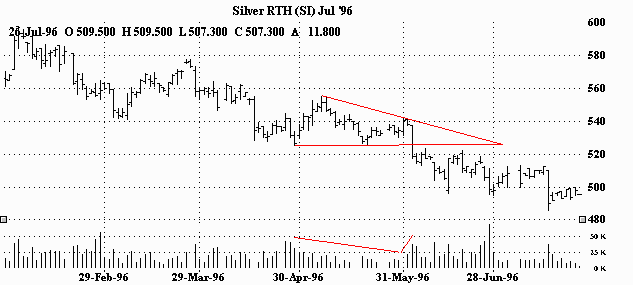
DESCENDING TRIANGLES IN A DOWNTREND (BEARISH)
|
|
|
|
These descending triangles presented two great opportunities to hop in on
the downtrend. While overall volume was noticeably larger in the second
triangle than in the first, in both instances volume weakened during the
pattern's formation and picked up on the breakout. |
|
|
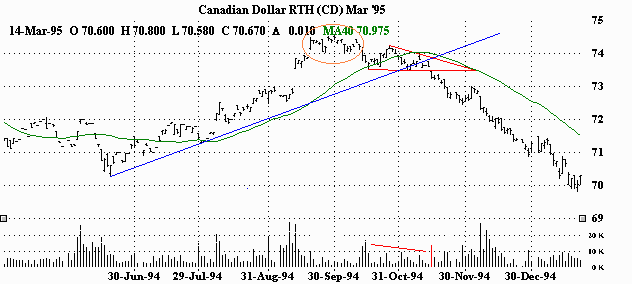
DESCENDING TRIANGLE IN THE BEGINNING OF A DOWNTREND (BEARISH)
|
|
|
|
This descending triangle is an interesting one. First of all, it's
in the very beginning of a downtrend. Second, it's preceded by three other
bearish signals; a relatively small head and shoulders top (can you see it?),
the flattening (and ultimately falling) of the moving average (simple 40-day)
and the breaking of the trendline. Notice that within days of falling below
the moving average and the trendline, the market broke through the bottom
of the descending triangle and sold off sharply. Volume behaves accordingly,
with activity diminishing during the formation of the pattern followed by
a burst of activity on the breakout. |
|
|
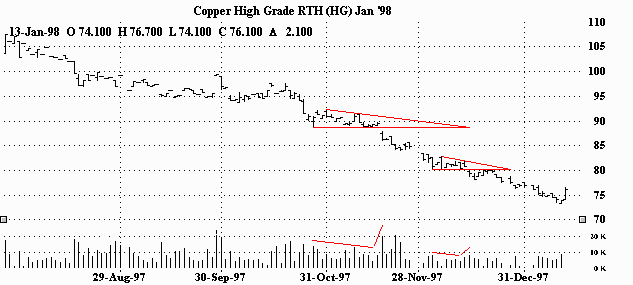
DESCENDING TRIANGLE IN A DOWNTREND (BEARISH)
|
|
|
|
Descending triangle in a downtrend (bearish).
The market had been in a steady decline for months. This
relatively brief pause served as only that; a relatively brief
pause in a continuing downtrend. The clearly definable pattern
gave great foreshadowing as to what was to come. |
|
|
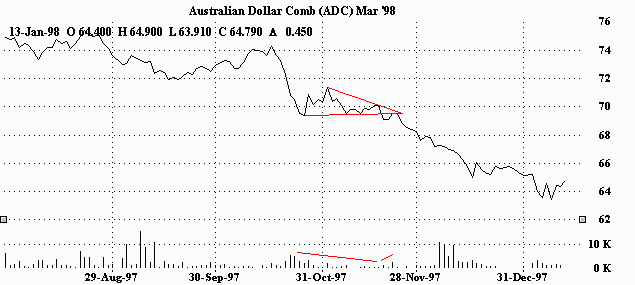
DESCENDING TRIANGLE IN A DOWNTREND (BEARISH)
|
|
|
|
Descending triangle in a downtrend. This example uses a line chart
instead of the more typical bar chart. Since the Australian Dollar is a
relatively thinly traded futures contract, viewing is much easier with this
type of format. (A chart riddled with gaps do to illiquidity can be
difficult to look at.) However, the descending triangle is unmistakable,
and is clearly just a brief pause before the market pushes lower. And
while it's not the easiest thing to see, there indeed is diminishing volume
during the formation of the pattern and a pick-up on the breakout. (Note
the "big" increase in volume as the downtrend picks up speed later on.) |
|
|
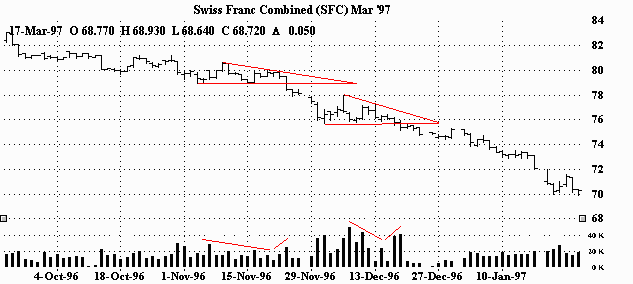
DESCENDING TRIANGLE IN A DOWNTREND (BEARISH)
|
|
|
|
An easily recognizable descending triangle in a downtrend. After about
a month long period of indecision, the market resolves itself in the direction
of the trend (down.) Volume dries up in the triangle with a sizable
increase on the breakout and further dump. |
|
|
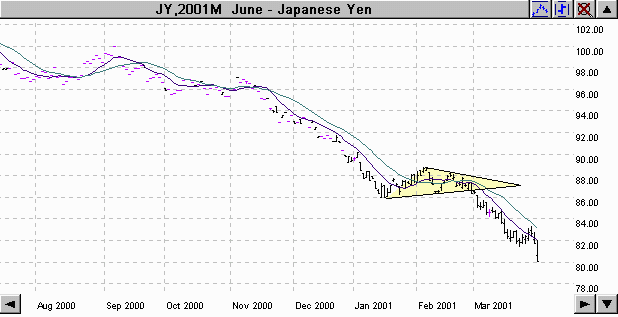
DESCENDING TRIANGLES IN A DOWNTREND (BEARISH)
|
|
|
|
These descending triangles gave a couple of good chances to catch this one.
As the downtrend pauses, volume drops. When it continues (breakout),
volume jumps. |
|
|
The information contained here was gathered from sources deemed reliable,
however, no claim is made as to its accuracy or content. This does not contain
specific recommendations to buy or sell at particular prices or times, nor
should any of the examples presented be deemed as such. There is a risk of
loss in trading futures and futures options and you should carefully consider
your financial position before making any trades. The reference to
statistical probabilities does not pertain to profitability, but rather to
the direction of the market. The size and the duration of the markets move,
as well as entry and exit prices ultimately determines success or failure
in a trade and is in no way represented in these statistics. Furthermore,
no representation is being made that any of the examples shown resulted
in actual trades. This is not, nor is it intended to be, a complete study
of chart patterns or technical analysis and should not be deemed as such.
|
|
|
Futures and options trading carries significant
risk and you can lose some, all or even more than your investment. |
|
|
Home
|