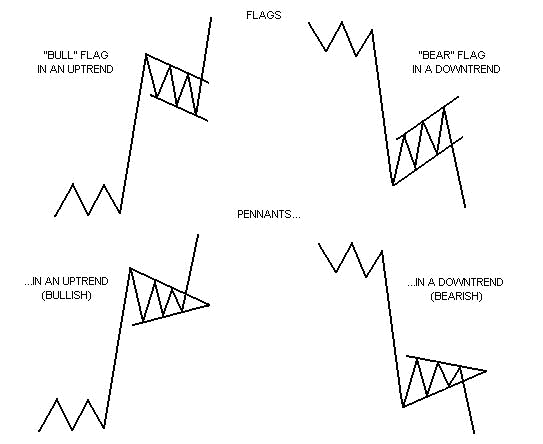
Flags and pennants can be categorized as continuation patterns. They usually represent only brief pauses in a dynamic market. They are typically seen right after a big, quick move. The market then usually takes off again in the same direction. Research has shown that these patterns are some of the most reliable continuation patterns. Bullish flags are characterized by lower tops and lower bottoms, with the pattern slanting against the trend. But unlike wedges, their trendlines run parallel. Bearish flags are comprised of higher tops and higher bottoms. "Bear" flags also have a tendency to slope against the trend. Their trendlines run parallel as well. Pennants look very much like symmetrical triangles. But pennants are typically smaller in size (volatility) and duration. (Volume generally contracts during the pause with an increase on the breakout.) (Chart examples of flag and pennant patterns using commodity charts.) (Stock charts.)
Futures and options trading carries significant risk and you can lose some, all or even more than your investment. Stock trading involves high risks and you can lose a significant amount of money. The information contained here was gathered from sources deemed reliable, however, no claim is made as to its accuracy or content. This does not contain specific recommendations to buy or sell at particular prices or times, nor should any of the examples presented be deemed as such. There is a risk of loss in trading futures and futures options and stocks and stocks options and you should carefully consider your financial position before making any trades. The reference to statistical probabilities does not pertain to profitability, but rather to the direction of the market. The size and the duration of the markets move, as well as entry and exit prices ultimately determines success or failure in a trade and is in no way represented in these statistics. This is not, nor is it intended to be, a complete study of chart patterns or technical analysis and should not be deemed as such.
|
