| |

|
Kevin Matras
1 (800) 767 - 3771, ext. 392
|
|
Customized
Screening and Portfolio Management
|
|

|
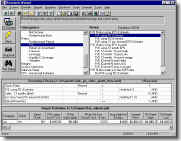
Screen
and report on over 8,500 companies using any of over 650 data
items and an unlimited number of custom calculations.
For example, do you want to identify 20 mid-cap, low P/E
stocks that reported EPS during the last 15 days, and had earnings
surprises above the median of their industries, upward estimate
revisions and no decrease in broker recommendations?
You
can!
Virtually
anything you want to look for, you can
ask the Research Wizard to find and have your answer within
seconds.
As you come up
with new ideas or things to look for, you can identify new potential buying
opportunities by creating new screening definitions.
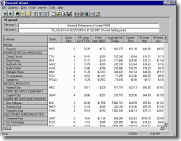
It then displays
your results in an easy to read format. They can be quickly set up
in many different ways and can report on any type of
item.
Once your screens and reports are created,
they can then be saved. You'll then have your own set of customized management tools to monitor your portfolio, all
readily available and automatically updated daily.
And all of the
information can be exported to other applications such as an Excel
spreadsheet.
|
 |
|
(click image to enlarge) |
|
|
|
|
(click image to enlarge) |
|

|
|
|
EZ
Screening: Pick the Best Stocks on the Most Popular Items
|
|

|
The EZ Screen
feature lets you scan for stocks using some of the most effective
pre-defined stock picking criteria. Simply
point-and-click to quickly find the stocks you're looking for.
And just like in
the detailed screening, it then displays
your results in an easy to read format.
You can save
your winning screens and reports to use again and again and of
course, all of the information can be exported to other programs.
|
 |
|
(click image to enlarge)
|
|

|
|
|
|
Stock
and Portfolio Ranking with Hot Maps and Scatter
Plots
|
|
|

|
Picking good
stocks for your portfolio is one thing. But it`s also important to
monitor your stocks attractiveness. Knowing which stocks in your
portfolio are doing the best, is just as important as knowing
which stocks in your portfolio are dragging it down. You can then
replace your losers or under-performers with new, more attractive
stocks to take their place.
With the Hot Map
charts in Zacks` Research Wizard software, you can graphically
evaluate the attractiveness of the stocks in your portfolio. You
can also evaluate new stocks from Zacks` database of over 8,500
companies based on the items you choose in your screen or report
definitions.
The stocks are
then ranked as colors, to quickly spot the best and the worst
companies with no guesswork.
Or plot the values of database items with the X-Y Scatter Plots.
|
 |
|
|
(click image to enlarge) |
|

|
|
|
|
Stock
and Portfolio Alert Reports |
|
|
|

|
The Alerts
Reports feature gives you with the ability to monitor for significant events
that can impact the prices of your stocks.
Research has
proven that stock prices move
before, during and after such events. Stock prices may respond
almost immediately to as
long as 90 days after these events. Alerts Reports notify you
immediately so you'll have time to
take action for a positive result.
|
|
|
|
(click image to enlarge)
|
|

|
|
|
Zacks Company Report / Snapshots |
|

|
The Zacks
Company Report is a single company report featuring company
description, actual and estimated EPS, company vs. industry
ratings, fundamental data, broker recommendations and price
charts.
All of your
salient, up to date decision making information is provided in one
easy to assess format.
It is available in both ICA and Research Wizard.
|
 |
|

|
(click image to enlarge)
|
|
|
Internet-Based Expanded Company Reports |
|
The
Research Wizard includes several expanded company reports,
displayed in your browser. These reports give you access to the
company's fundamental data, insider data, and a company's general
information.
|
|
|

|
|
|
The
Best Performing Rating System – Period!
|
|
|
With
the Research Wizard, you get exclusive access to the The Zacks
Rank.
The Zacks Rank is based upon a proprietary stock selection model
developed by Zacks Investment Research in 1980. The ranking
predicts which stocks will outperform or underperform the market
averages during the next three months.
The
1 to 5 ranking (1=Best Expected Performance) is derived entirely
from a multi-factor model which analyzes the momentum of analysts'
earnings estimate revisions. It’s completely different than the
average broker ratings with extremely impressive statistics.
In
fact, the Zacks #1 Ranked stocks over the last 22 years, has shown
an average annual return of over 34%! That’s literally more than
twice as good as the S&P 500. It even performed great in 2000
and 2001, showing returns of 16.2% and 18.7% respectively. (And
it’s up nearly 12% in just the first half of this year.) WOW!
And
our #5 ranked stocks (stocks to dump) have significantly
underperformed the market over that same period. Not only will you
know what to buy, but you’ll also know when to get rid of it.
Imagine
having access to this exclusive stock analysis. (Imagine if you
had it over the last 2 years!)
|
Year
|
Zacks
Rank
|
Benchmark
|
|
|
#1
Stocks
|
S
& P 500
|
|
|
%
Return
|
%
Return
|
|
|
|
|
|
1980
|
55.00
|
32.40
|
|
1981
|
14.10
|
-5.30
|
|
1982
|
42.03
|
21.60
|
|
1983
|
48.30
|
22.60
|
|
1984
|
0.60
|
6.30
|
|
1985
|
49.00
|
31.00
|
|
1986
|
30.00
|
18.60
|
|
1987
|
7.50
|
5.10
|
|
1988
|
43.20
|
16.20
|
|
1989
|
45.20
|
31.70
|
|
1990
|
-1.10
|
-3.60
|
|
1991
|
81.90
|
28.70
|
|
1992
|
43.20
|
7.50
|
|
1993
|
44.62
|
10.07
|
|
1994
|
15.58
|
0.59
|
|
1995
|
53.84
|
36.31
|
|
1996
|
45.44
|
22.36
|
|
1997
|
45.75
|
33.25
|
|
1998
|
21.88
|
28.57
|
|
1999
|
48.75
|
21.03
|
|
2000
|
16.24
|
-9.10
|
|
2001
|
18.67
|
-11.88
|
|
|
|
|
|
Annualized
|
34.99%
|
15.64%
|
|
|
|

|
|
|
Backtesting |
|

|
With the
Research Wizard you can backtest and produce reports showing the performance of
your screens. The Backtest option in the Research Wizard enables
you to select a saved screen definition and to test it
historically. The backtest report also allows you to view your
screens performance relative to a benchmark, such as the S&P
500 over time.
The Historical
Performance of the Screen Report shows a summary of the strategy
and compares it with the market. It shows statistics
such as portfolio return, benchmark return and excess returns for
entire time span and for individual periods. It also displays how
the investment strategy performed in both up and down markets.
|
 |
|
|
(click image to enlarge)
|
|
Zacks.
The Power to OutPerform !
To see the program in action,
click below to see the
Research
Wizard
movie / tutorial !
|
|
|

Call Kevin
Matras at: 1 (800) 767-3771, ext. 392 or e-mail
us now for
a FREE 2 week trial.
And ask for your "live" demo.
|
|
Zacks
Investment Research, Inc.
For
additional information, contact kevinm@zacks.com.
1
(800) 767-3771, ext. 392
1 (312) 630-9880, ext. 392
155
N. Wacker Dr., Chicago, IL 60605
Copyright © 2001 Zacks Investment Research, Inc.
|
|
|