|
INVERTED HEAD AND SHOULDERS AS A REVERSAL PATTERN IN A DOWNTREND
(BULLISH)
|
|
|
|
The inverted head and shoulders signaled a bottom. While the left shoulder
actually dipped a bit lower than the head, everything else appears to be
'text-book' in its formation. Diminished volume on the bottoms and
an increase in volume on the breaking of the neckline. (In fact, you'll
notice that the market gapped above it!) |
|
|
INVERTED HEAD AND SHOULDERS AS A REVERSAL PATTERN IN DOWNTREND
(BULLISH)
|
|
(Charting software by Gecko-Charts 2000.)
|
|
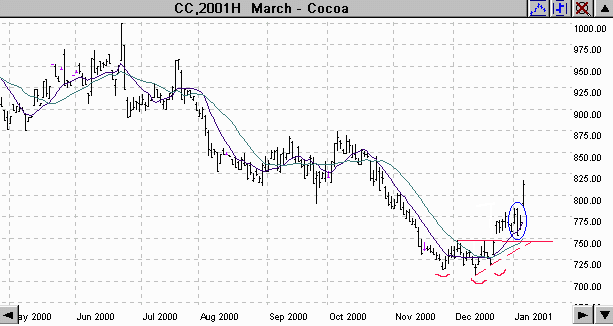
Can you see the inverted head and shoulders in the
downtrend. A clear bullish foreshadowing as to what was to come. Notice
how the market breaks out through the neckline (it actually gaps above
it), ... comes back to re-test
it and then powers back up. |
|
|
INVERTED HEAD AND SHOULDERS AS A REVERSAL PATTERN IN A MINOR DOWNTREND
(BULLISH)
|
|
|
|
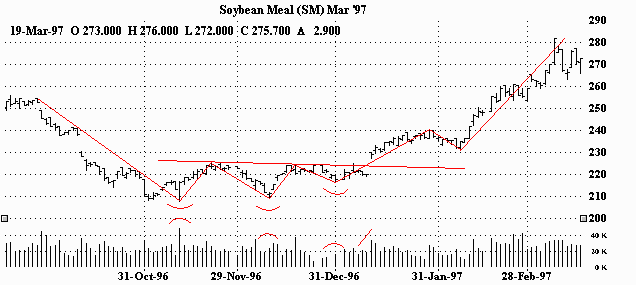
This inverted head and shoulders pattern reversed a minor downturn. And
while the right shoulder's decline exceeded the left shoulder's, the pattern
effectively ended the downtrend. Volume declined on the bottoms and
picked up on the breaking of the neckline. (Note the gap on the breakout!)
(This market ultimately climbed to over 67 cents by the end of
March.) |
|
|
INVERTED HEAD AND SHOULDERS AS A REVERSAL PATTERN IN A MINOR DOWNTREND
(BULLISH)
|
|
|
|
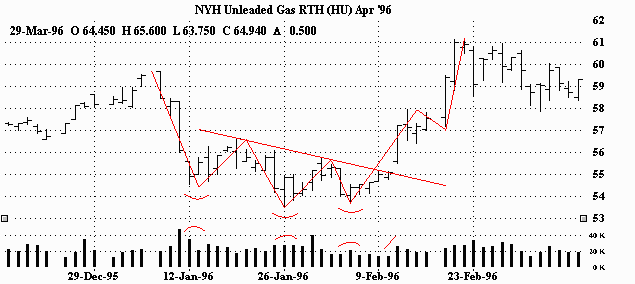
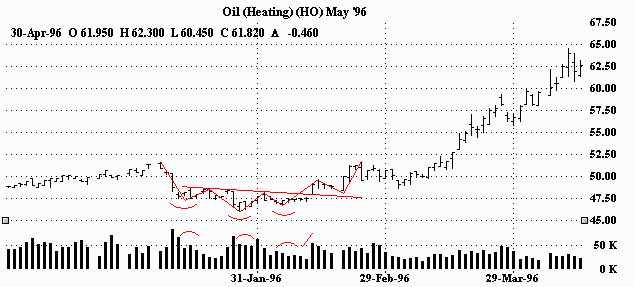
How's that for a reversal?! This relatively small inverted head and
shoulders pattern marked the end to heating oil's minor downtrend and the
beginning to a powerful rally. As in the unleaded gasoline chart, the
right shoulder dips a bit further than the left, but also gaps through the
neckline! Volume acts accordingly with a lessening of activity on each
bottom and a burst of activity on the breakout. |
|
|
INVERTED HEAD AND SHOULDERS AS A REVERSAL PATTERN IN A DOWNTREND
(BULLISH)
|
|
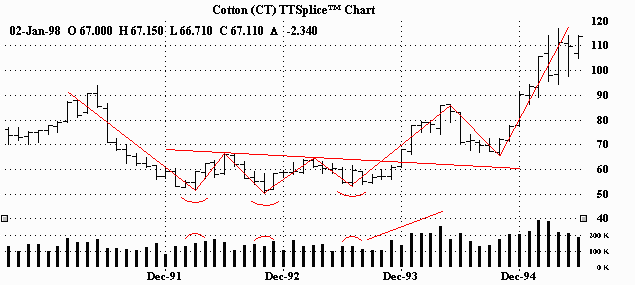
Monthly Continuation (or Splice) Chart
|
|
The inverted head and shoulders reversed a lengthy downtrend. As you
can see, it also took about two years to complete the pattern. But
given the size and the duration of the ensuing bull run, it looks like it
was worth the wait. Keep in mind that on this example, we're using
a monthly chart. Each bar represents a months worth of price and volume.
Upon closer examination, you can see that the volume lightens up on the bottoms.
However, the jump in volume on the breaking of the neckline and especially
on the continuing upmove is clearly visible. |
|
|
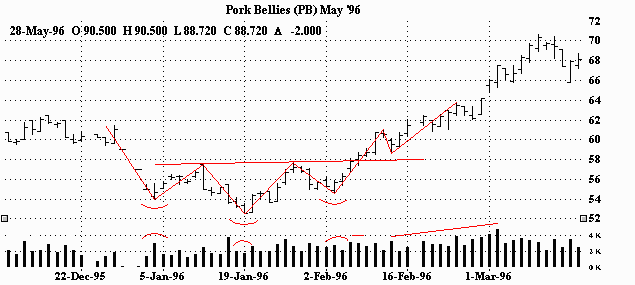
INVERTED HEAD AND SHOULDERS AS A REVERSAL PATTERN IN A MINOR DOWNTREND
(BULLISH)
|
|
|
|
The inverted head and shoulders reversed this minor downtrend. The
price traced out a classic pattern. While it's true there was a bit more
activity on the right shoulder than the head, volume still showed a tendency
to lighten on the bottoms with a pick-up on the breaking of the neckline.
You can also see the volume increase as the market continues its trek
higher. |
|
|

|
|
|
The information contained here was gathered from sources deemed reliable,
however, no claim is made as to its accuracy or content. This does not contain
specific recommendations to buy or sell at particular prices or times, nor
should any of the examples presented be deemed as such. There is a risk of
loss in trading futures and futures options and you should carefully consider
your financial position before making any trades. The reference to
statistical probabilities does not pertain to profitability, but rather to
the direction of the market. The size and the duration of the markets move,
as well as entry and exit prices ultimately determines success or failure
in a trade and is in no way represented in these statistics. Furthermore,
no representation is being made that any of the examples shown resulted
in actual trades. This is not, nor is it intended to be, a complete study
of chart patterns or technical analysis and should not be deemed as such.
|
|
|
Futures and options trading carries significant
risk and you can lose some, all or even more than your investment. |
|
|
Home
|