CHART EXAMPLES OF SYMMETRICAL
TRIANGLE
PATTERNS / STOCKS
|
|
|
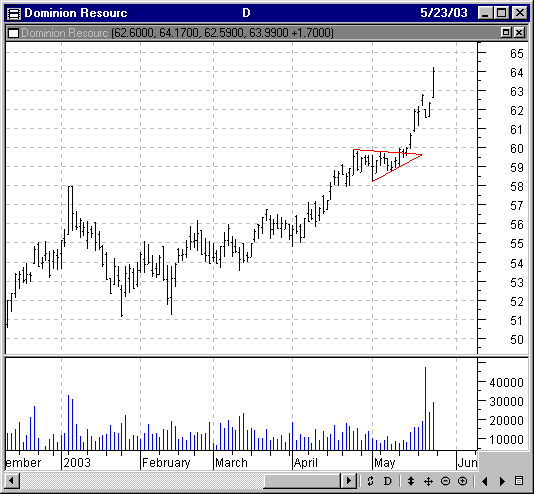
D / Dominion Resources, Inc. |
|
|
|
Symmetrical triangle in an uptrend (bullish). Dominion Resources, Inc. (D), from PRS, Vol. 3, No. 17, for the week of 5/12/03. (This is so easy.) |
|
|
|
|
|
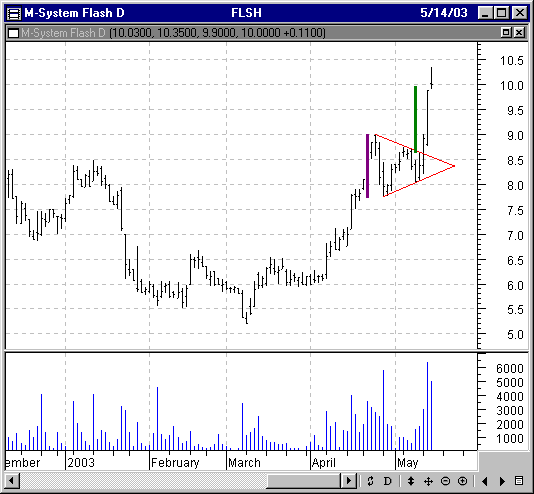
FLSH / M-Systems Flash Disk Pioneers, Ltd. |
|
|
|
Symmetrical triangle in an uptrend (bullish). M-Systems Flash Disk Pioneers, Ltd. (FLSH), from PRS, Vol. 3, No. 17, for the week of 5/12/03. Measure the base, add it to the breakout point and determine your measured price target. (Notice how the volume picked-up on its breakout and continued to increase on the follow-thru higher.) |
|
|
|
|
|
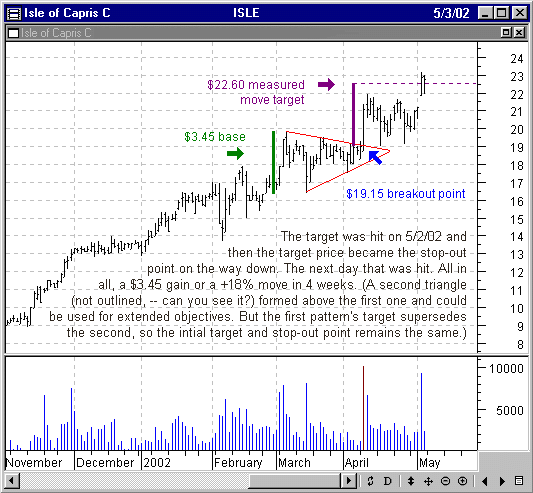
ISLE / Isle of Capri Casinos, Inc. |
|
|
|
Symmetrical triangle in an uptrend (bullish). Isle of Capri Casinos, Inc. (ISLE), from PRS, Vol. 2, No. 12, for the week of 4/8/02. Measure the base, add it to the breakout point and determine your measured price target. (Look at the huge volume on its breakout day.) |
|
|
|
|
|
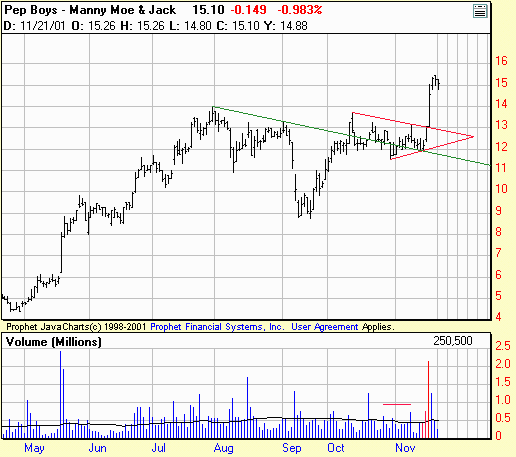
PBY / Pep Boys - Manny, Moe & Jack |
|
|
|
Symmetrical triangle in an uptrend (bullish). Notice how the previous resistance (green trendline), became support later on. (Trends and trendlines.) After its pull-back from its first 52 week high in July, PBY then regrouped and found new buying. It then pushed through resistance and consolidated along that trendline for about a month. (Notice how the volume flattened out as the market was basing and forming the triangle consolidation.) Finally, after one last re-test of the trendline resistance, which had now become support, the price and volume started to climb, culminating into an explosive breakout, accompanied by an equally explosive jump in volume. This is a text book example on so many levels. |
|
|
|
|
|
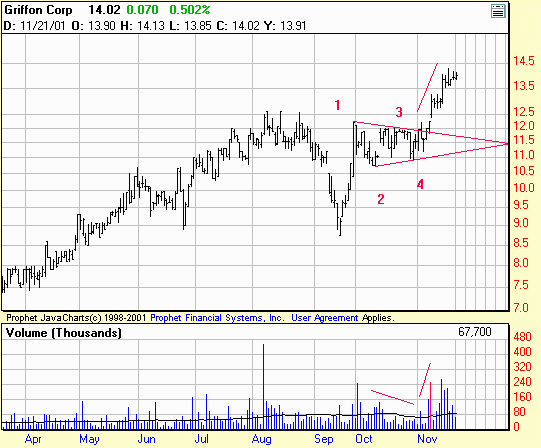
GFF / Griffon Corp. |
|
|
|
Symmetrical triangle in an uptrend. (I've numbered the points (1-4). A triangle of course needs 4 points.) Notice how the volume diminishes during the formation of the pattern, then jumps on the market's successful breakout. |
|
|
|
|
|
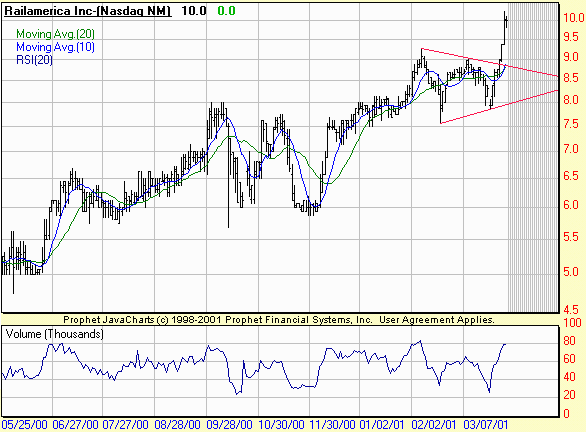
RAIL / Railamerica, Inc. |
|
|
|
Symmetrical triangle in an uptrend (bullish). Clear cut pattern with a typical result. Notice how the On Balance Volume (OBV) indicator also confirms the move, rising sharply with the price. |
|
|
|
|
|
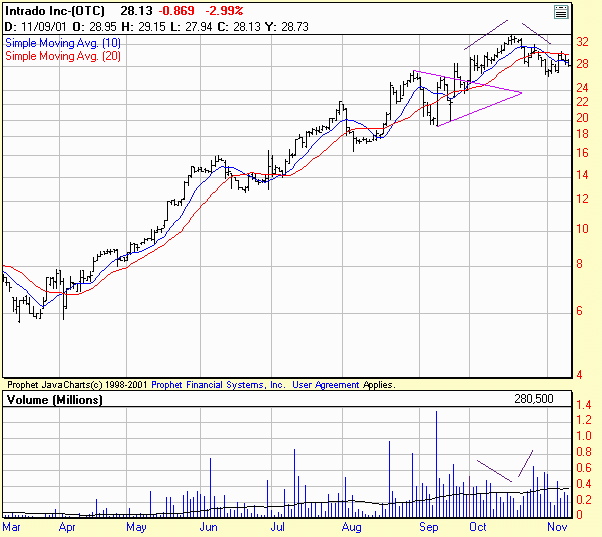
TRDO / Intrado, Inc. |
|
|
|
Symmetrical triangle in an uptrend. This, this is also a great example on the importance of volume. (More on volume.) You have the typical increase in volume on the breakout, but volume diminishes on the advance (opposite of what a strong market should do), which is a good foreshadowing of an impending correction. As the correction begins, notice how the volume then picks up. Also, not a characteristic of a strong market, but rather a market where there are more sellers than buyers (bearish). Pay attention to these things to alert you to waning trends and beginnings of new ones. |
|
|
|
|
|
DPL / The Dayton Power and Light Company, Inc. |
|
|
|
Symmetrical triangle in an uptrend. After a good advance, this symmetrical triangle gave a nice opportunity to hop on board. |
|
|
|
SYMMETRICAL TRIANGLE IN A DOWNTREND (BEARISH) |
|
DE / Deere & Co. |
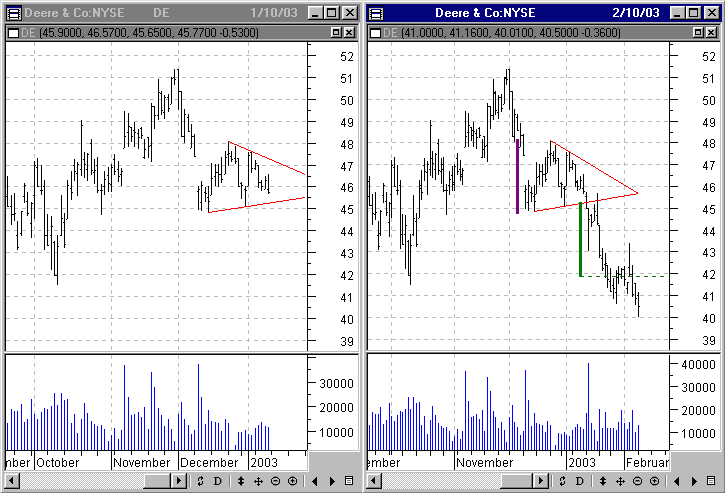 |
| Symmetrical triangle in a downtrend (bearish). From PRS, Vol. 3, No. 2, for the week of 1/13/03. |
|
|
|
|
|
|
|
The information contained here was gathered from sources deemed reliable, however, no claim is made as to its accuracy or content. This does not contain specific recommendations to buy or sell at particular prices or times, nor should any of the examples presented be deemed as such. There is a risk of loss in trading stocks and stocks options and you should carefully consider your financial position before making any trades. The reference to statistical probabilities does not pertain to profitability, but rather to the direction of the market. The size and the duration of the markets move, as well as entry and exit prices ultimately determines success or failure in a trade and is in no way represented in these statistics. Furthermore, no representation is being made that any of the examples shown resulted in actual trades. This is not, nor is it intended to be, a complete study of chart patterns or technical analysis and should not be deemed as such. |
|
|
|
Stock trading involves high risks and you can lose a significant amount of money. |
|
|