CHART EXAMPLES OF WEDGE
PATTERNS / COMMODITIES
FALLING WEDGE IN THE BEGINNING OF AN UPTREND (BULLISH)
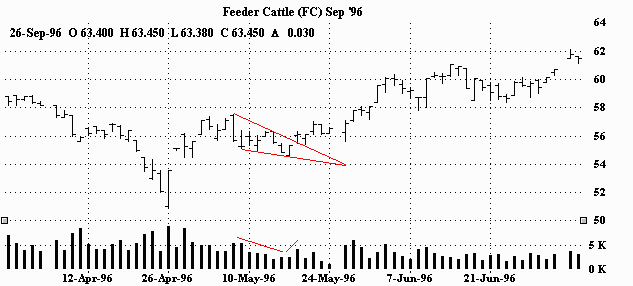
Here's a falling wedge in the very beginning of an uptrend. As you
can see, volume dissipates during the formation of the wedge pattern and
then picks up on the breakout.
FALLING WEDGE IN AN UPTREND (BULLISH)
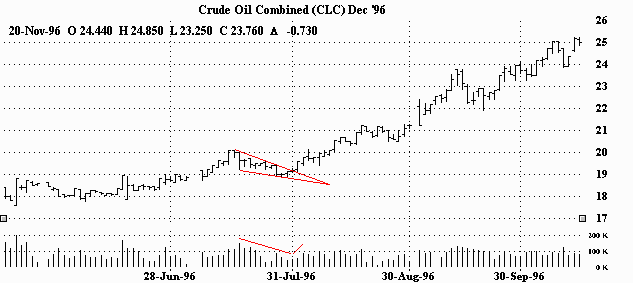
Falling wedge in an uptrend. After more than a $2.00 rally, the market
pauses before continuing higher for an impressive run. Volume dips during
this pause and then picks up on the breakout and trek higher.
FALLING WEDGE IN A DOWNTREND (BULLISH)
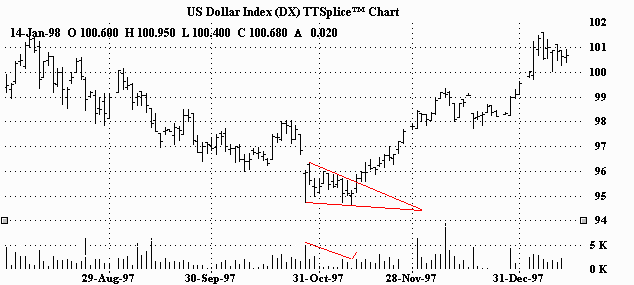
Falling wedge in a downtrend. This pattern was able to reverse the
downtrend nicely. Volume drops off in the wedge and then comes back
as the market moves out of the pattern.
FALLING WEDGE IN A DOWNTREND (BULLISH)
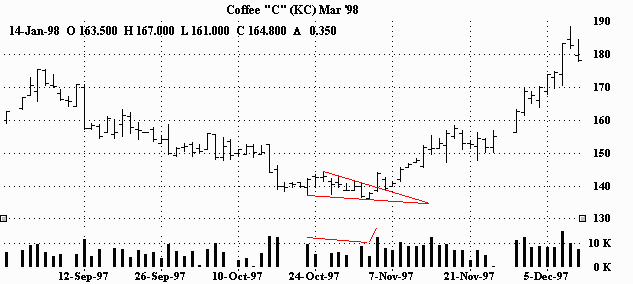
Falling wedge in downtrend. Nice reversal. After waning volume
in the wedge, there's a good increase on the breakout. In fact, these good
volume readings were able to sustain themselves during the move higher.
RISING WEDGE IN AN UPTREND (BEARISH)
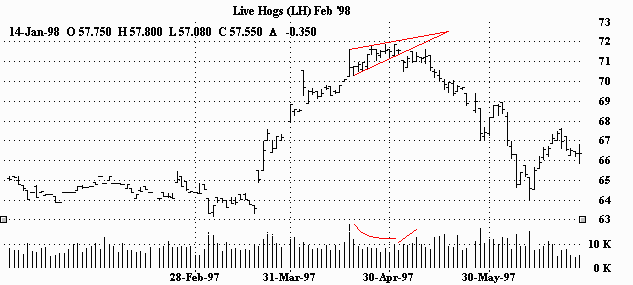
The rising wedge put a stop to this uptrend. Volume tails off as the
trend struggles. Volume expands as the market falls through the bottom
of the wedge and the new downtrend begins.
RISING WEDGE IN AN UPTREND (BEARISH)
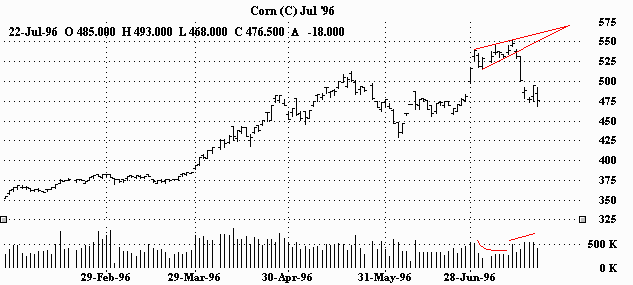
This rising wedge stopped corn dead in its tracks! (As you can see,
July corn went off the board shortly after the downside breakout, but
nevertheless, lost more than 70 cents in just six days - WOW!) As for
volume, the story remains the same. Volume falls off in the wedge and jumps
on the breakout.
RISING WEDGE IN A DOWNTREND (BEARISH)
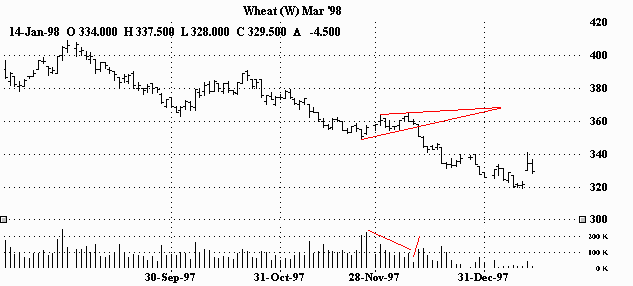
This rising wedge seemingly presented an area of indecision. However,
within a few weeks the market resolved itself in the direction of the trend
(down.) As usual, volume increases on the breakout after diminishing
during the pattern.
RISING WEDGE IN A DOWNTREND (BEARISH)
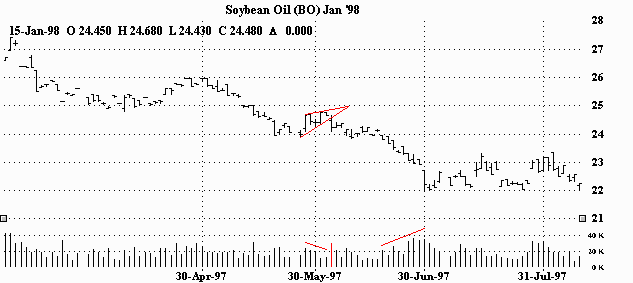
Rising wedge in a downtrend. A short pause followed by renewed downside
conviction. And once again, volume dries up in the pattern and increases
on the breakout. (Notice how the volume really starts to pick up as
the downtrend gains momentum shortly after the break.)
|
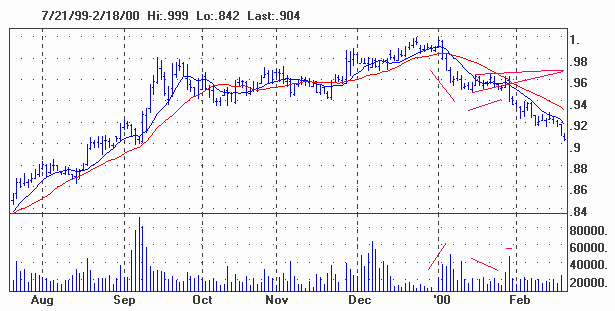
RISING WEDGE IN A DOWNTREND (BEARISH)
h |
|
Japanese Yen (Nearest Future /
March '00) |
|
|
|
The Japanese yen, broke out of a rising wedge
in a waning uptrend (new downtrend) and continued to move lower
and lower. The wedge actually had a small false break, with a
return move back into the pattern, but the wedge's upper
parameter was never challenged and it quickly plunged through
the bottom. Notice how the volume forecasted the down move. The
volume increases on the first move off of the highs, then
flattens (actually falls a bit) during the formation of the
pattern. The volume then spikes up as the market collapses
through the wedge. |
|
|
chartpatterns.com's |
 |
|
|
The information contained here was gathered from sources deemed reliable,
however, no claim is made as to its accuracy or content. This does not contain
specific recommendations to buy or sell at particular prices or times, nor
should any of the examples presented be deemed as such. There is a risk of
loss in trading futures and futures options and you should carefully consider
your financial position before making any trades. The reference to
statistical probabilities does not pertain to profitability, but rather to
the direction of the market. The size and the duration of the markets move,
as well as entry and exit prices ultimately determines success or failure
in a trade and is in no way represented in these statistics. Furthermore,
no representation is being made that any of the examples shown resulted
in actual trades. This is not, nor is it intended to be, a complete study
of chart patterns or technical analysis and should not be deemed as such. |
|
|
Futures and options trading carries significant
risk and you can lose some, all or even more than your investment. |
|
Home |